
Getting Started with Be Heard
When you log in, your view depends on your role. When a SurveyAdmin or SurveyManager logs in to Be Heard, the first page they see is the All Surveys list. This page is the control hub for managing surveys.
Overall Page Layout
The Be Heard homepage (All Surveys) shows the navigation menu, main content area, and key interface elements.
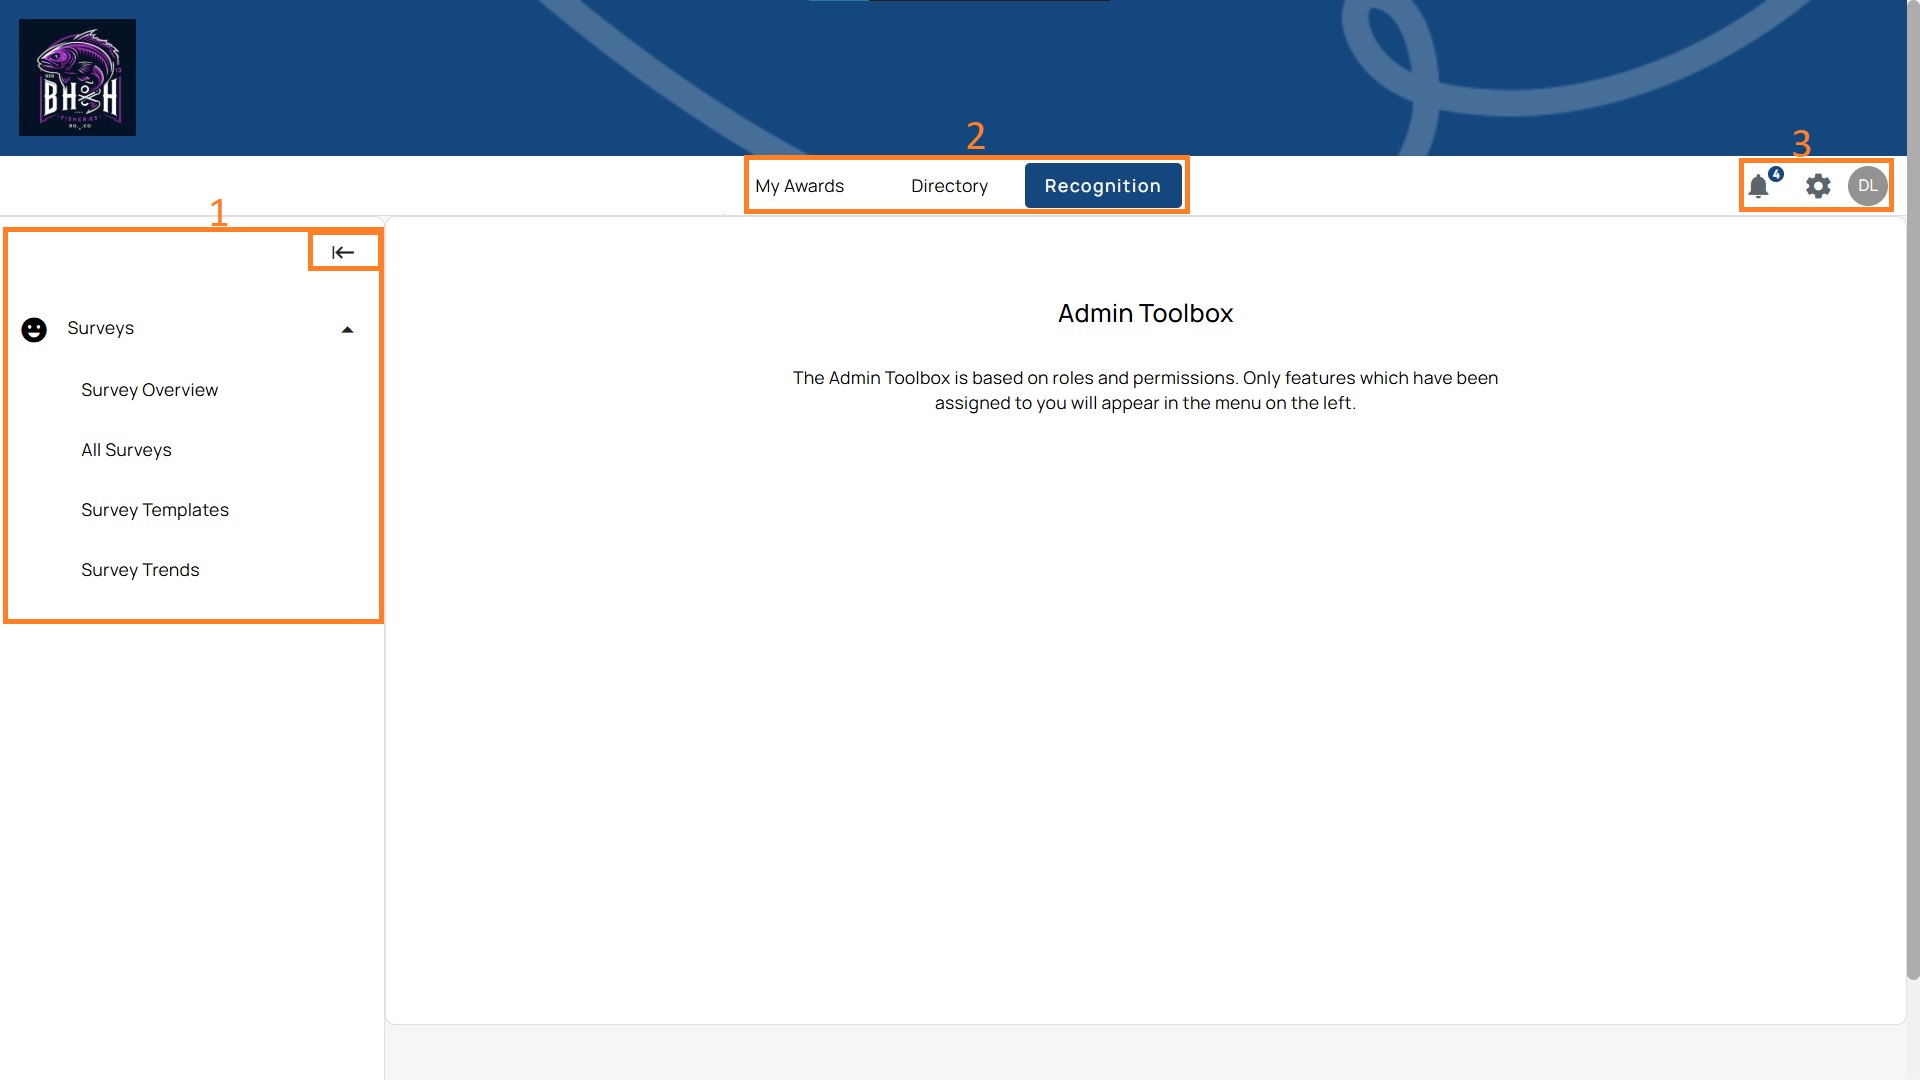
1. Left Navigation (Side Menu)
- An icon to expand the menu
- A menu dedicated to survey functions:
- Survey Overview – View your organization's survey activity at a glance
- All Surveys – List of all Fixed-Date and Automated surveys.
- Survey Templates – Access and manage reusable survey blueprints handpicked by Be Heard experts.
- Survey Trends – Track feedback over time using tags and comparisons.
2. Top Navigation Bar
- Tabs – “My Awards”, “Directory”, and “Recognition”. These are shared navigation items across Terryberry’s suite but may remain visible in Be Heard.
Note: The Admin Toolbox is based on roles and permissions. Only features that have been assigned to you will appear in the menu on the left.
3. Right-Side Icons
- Notifications (bell icon)
- Displays alerts such as survey participation reminders, survey closing soon, or updates pushed by admins.
- A badge (number) indicates unread notifications.
- Settings (gear icon)
- Opens system-level preferences. Typically includes display adjustments, integrations, or feature toggles depending on permissions.
- Profile (initials circle, e.g., “TP” or a profile picture)
- Expands into a dropdown with personal account settings:
- My Profile – Update account details.
- Dark Mode – Switch between light and dark themes.
- Language – Change the interface language.
- Clear Cache – Reset stored settings for troubleshooting.
- Chat with an Expert – Direct link to support.
- Log Out – End the session securely.
- Expands into a dropdown with personal account settings:
Main Content Area
Survey Overview
The Survey Overview page gives you a snapshot of your organization's survey activity and engagement metrics at a glance.
Accessing Survey Overview
Navigate to Recognition in the top menu, then select Surveys from the left sidebar. Click Survey Overview.
Overview Section
The Overview section displays your current survey pipeline:
- Live – Surveys actively collecting responses
- Launching soon – Scheduled surveys not yet open
- Draft – Surveys in progress, not yet published
- Recently closed – Surveys that have finished collecting responses
Click All surveys to view the complete list of surveys across all statuses.
Engagement Snapshot
Overall Participation
Shows participation rates across all company surveys. The donut chart breaks down survey completion by status:
- Complete – Employees who finished the survey
- Partially Complete – Employees who started but haven't finished
- Not Started – Employees who haven't begun
Click Participation trends to view participation rates over time.
Overall eNPS
Displays the aggregate eNPS (Employee Net Promoter Score) calculated from all surveys containing an eNPS question. The gauge shows your score on a scale from -100 to 100.
Click eNPS trends to track how employee sentiment changes over time.
Engagement Indicator Insights
This section shows performance across the six key engagement indicators. Each indicator displays:
- Indicator Score – Raw score based on survey responses
- Likert Score – Average rating on the Likert scale
- Positive Sentiment – Percentage of favorable responses
Indicators are labeled with performance levels:
- Needs Attention (red)
- Good (yellow/amber)
- Excellent (green)
Click Indicator trends to view how each engagement indicator has changed over time.
Use the Lowest to Highest toggle to sort indicators by score and quickly identify areas needing focus.
The Six Engagement Indicators:
- Leadership
- Equity
- Empowerment
- Purpose
- Wellbeing
- Belonging
All Surveys Page
The page is divided into two main views: Fixed-Date and Automated surveys.
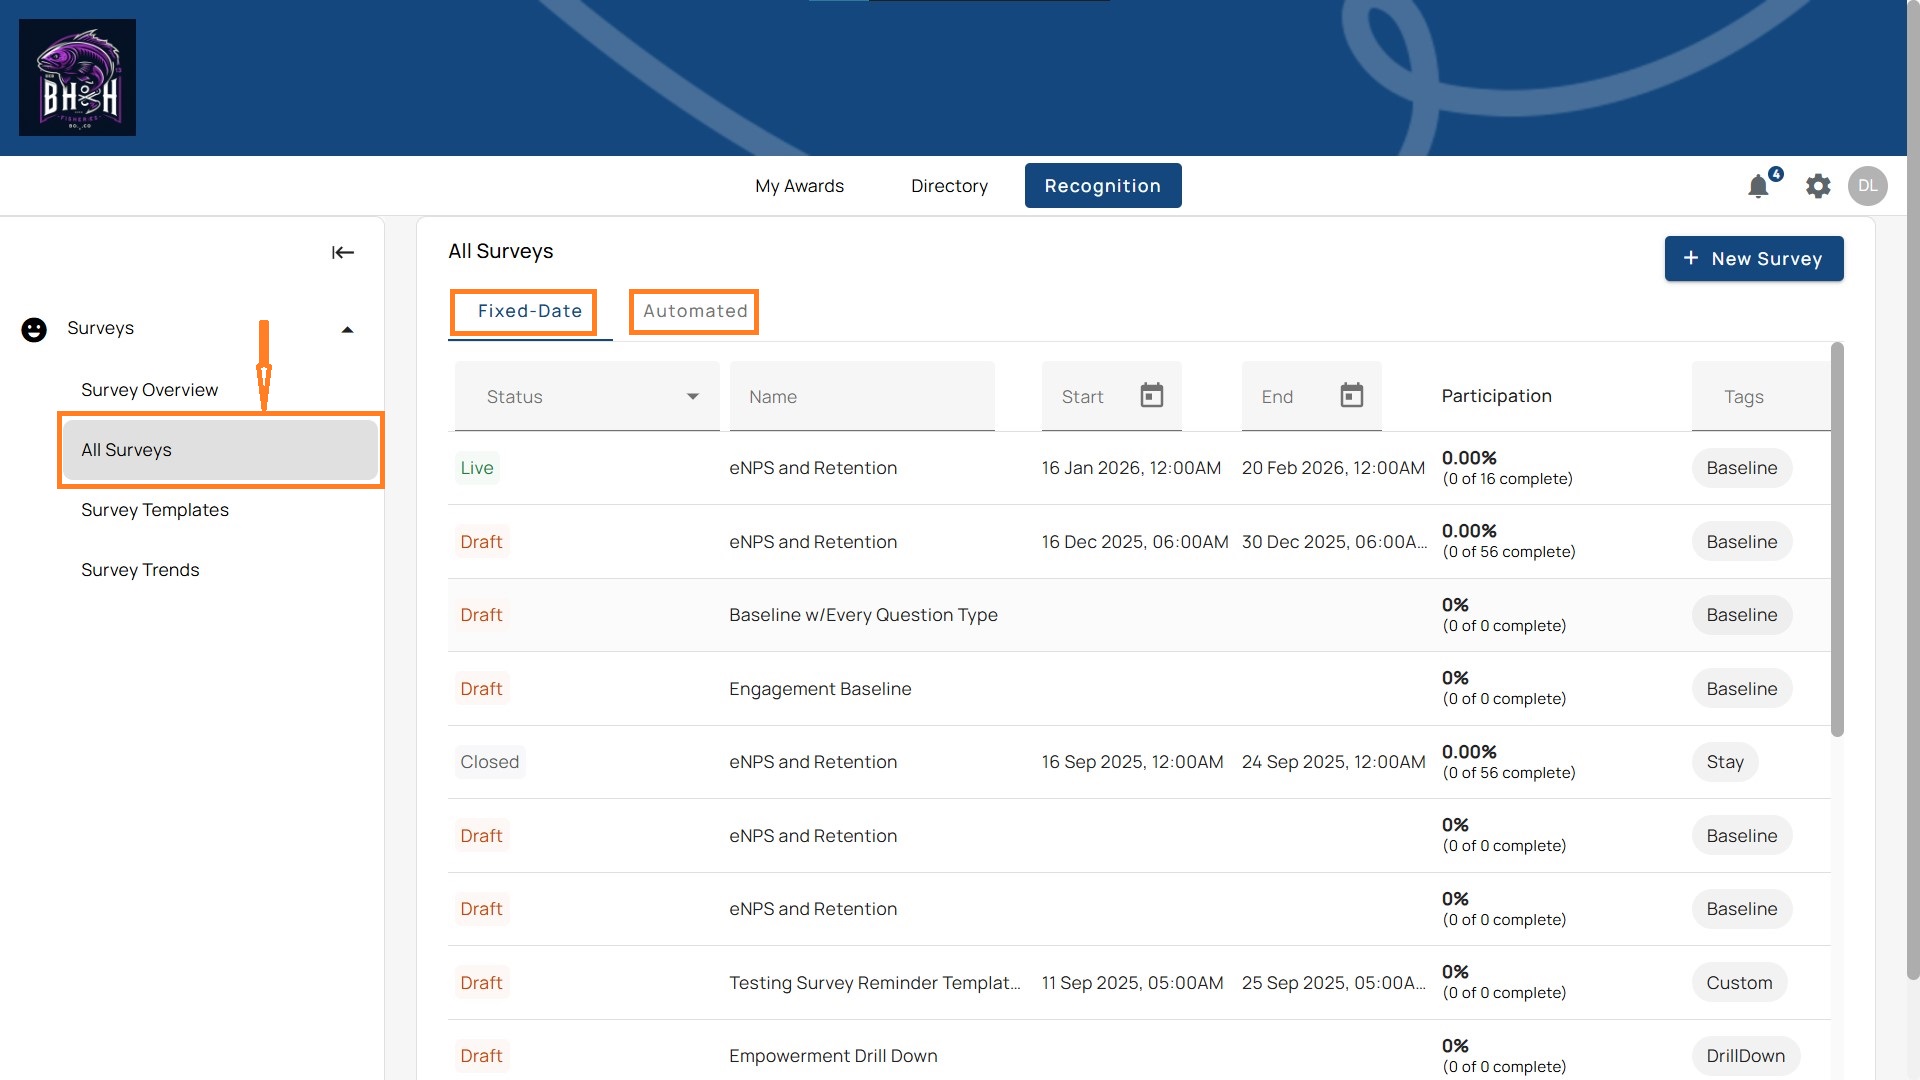
Fixed-Date Surveys
These are one-time surveys scheduled to start and end on specific dates.
Key Columns
- Status – Draft, Active, or Closed.
- Name – The survey title (e.g., Engagement Baseline, eNPS and Retention).
- Start / End – Fixed dates when the survey opens and closes.
- Participation – Tracks completion rates (e.g., 50%, 0 of 72 complete).
- Tags – Labels such as Baseline, Pulse, Custom.
- Actions
- Edit – Update settings before launch or while in draft.
- Results – Open report when data is available.
- More (…) – Extra options to Save as Template or Delete.
Use Case: Best for periodic or company-wide surveys (e.g., annual engagement, retention studies).
Automated Surveys
These surveys trigger automatically based on system events.
Key Columns
- Status – Auto (active automation) or Draft.
- Name – The automated survey title (e.g., New Hire Day 1).
- Launch Event – What triggers the survey (e.g., “Added as Participant, +1 day”).
- Duration – How long the survey stays open (e.g., 7 days).
- Participation – Real-time completion metrics.
- Tags – Labels such as NewHire, Baseline.
- Actions
- Edit – Adjust trigger settings, duration, or questions.
- Results – Open report when responses exist.
- More (…) – Options for duplication or removal.
Use Case: Best for lifecycle feedback (e.g., onboarding, exit, promotion checkpoints).
Getting Started as a SurveyAdmin
SurveyAdmins can do more in the settings. However, the Admin Toolbox is based on roles and permissions. Only features that have been assigned will appear in the menu on the left.
Full administrative control over all survey functions and data, including:
- Set up survey features (dimensions, anonymity, tags).
- Assign SurveyManager permissions where needed.
- Apply anonymity rules (e.g., minimum group size, locked results until close, permanent deletion of identifiable data).
- Prepare templates or AI-built surveys for launch.
- Monitor survey participation and lock/unlock features as needed.
Getting Started as a SurveyManager
SurveyManagers receive links in notifications, which allow them to view or manage only the surveys assigned to them. They can also view results.
- Log in and check the results for assigned surveys.
- Confirm participants are correctly listed.
- Monitor indicators such as eNPS, engagement, and participation.
- Filter results by department, tenure, or other attributes.
- Share reports or exports with teams.