
Survey Trends
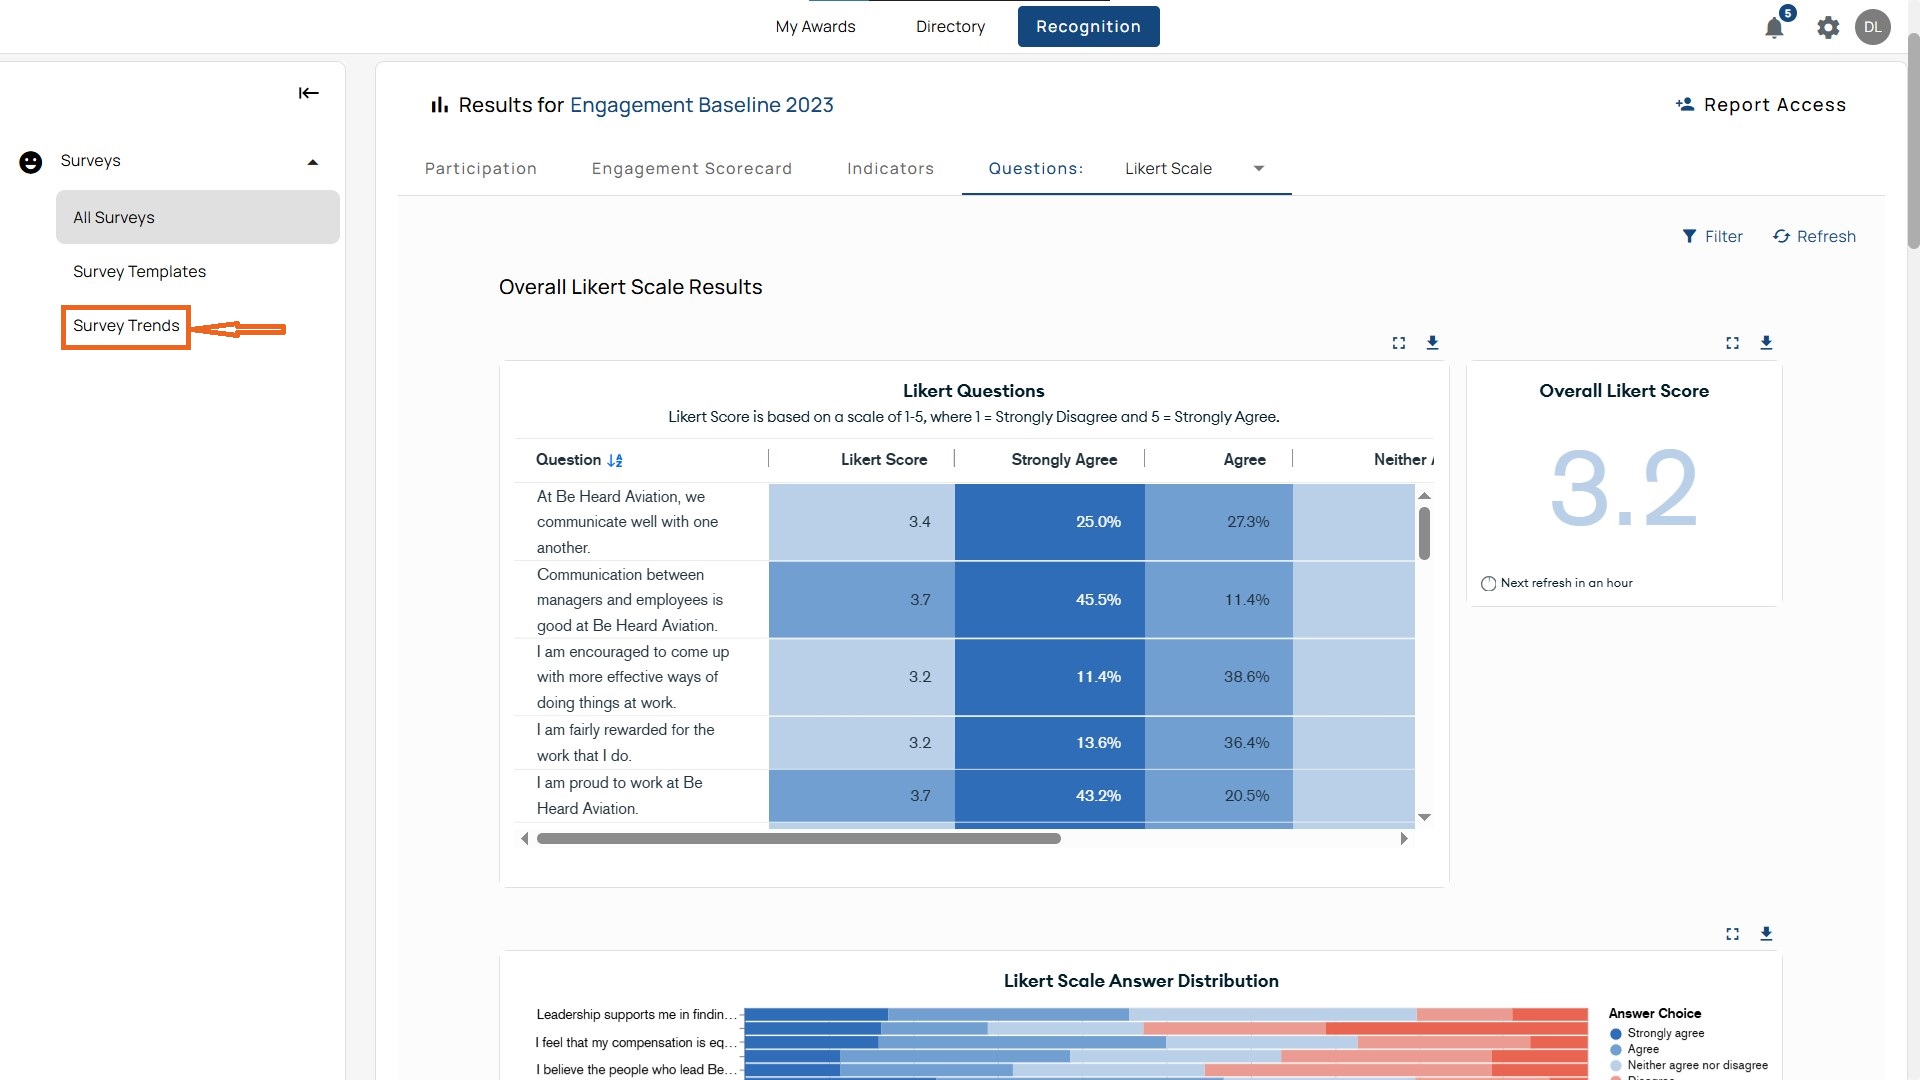
Access from the left menu, click Surveys → Survey Trends.
Why Trends Matter
- Trends indicate whether changes in culture, leadership, or recognition are having a lasting impact.
- Filters enable you to drill down into which groups are improving, struggling, or maintaining their current level.
Key Views in Survey Trends
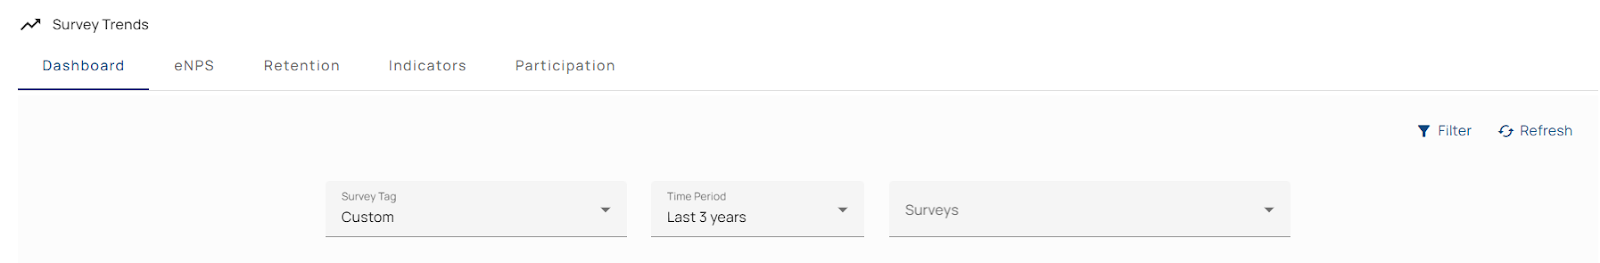
Survey Trends Elements
- Survey Tag: Select Baseline, Pulse, New Hire, or Custom tags to adjust the dataset. You can also make multiple selections.
- Time Period: Choose from 3 months → all available years.
- Surveys: Check/uncheck individual surveys within the tag selection.
- Filters: Refine by dimensions such as department, country, tenure, gender, etc.
- Example: You can view eNPS trends for part-time employees in Sales in Canada by combining survey tags, a date range, and filters.
View Per Report
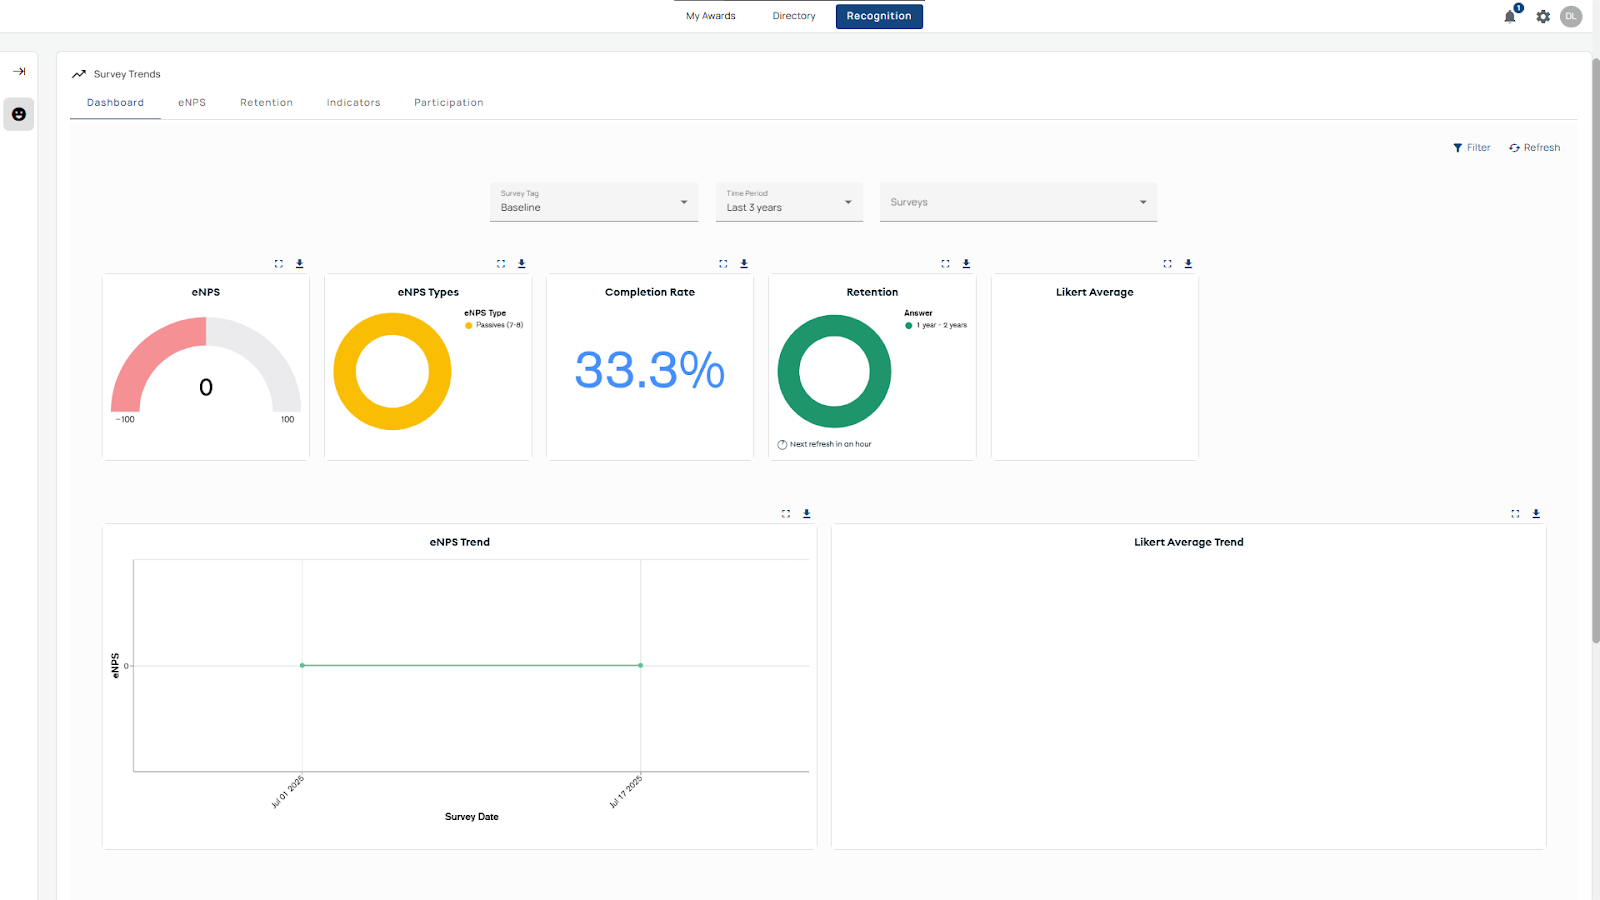
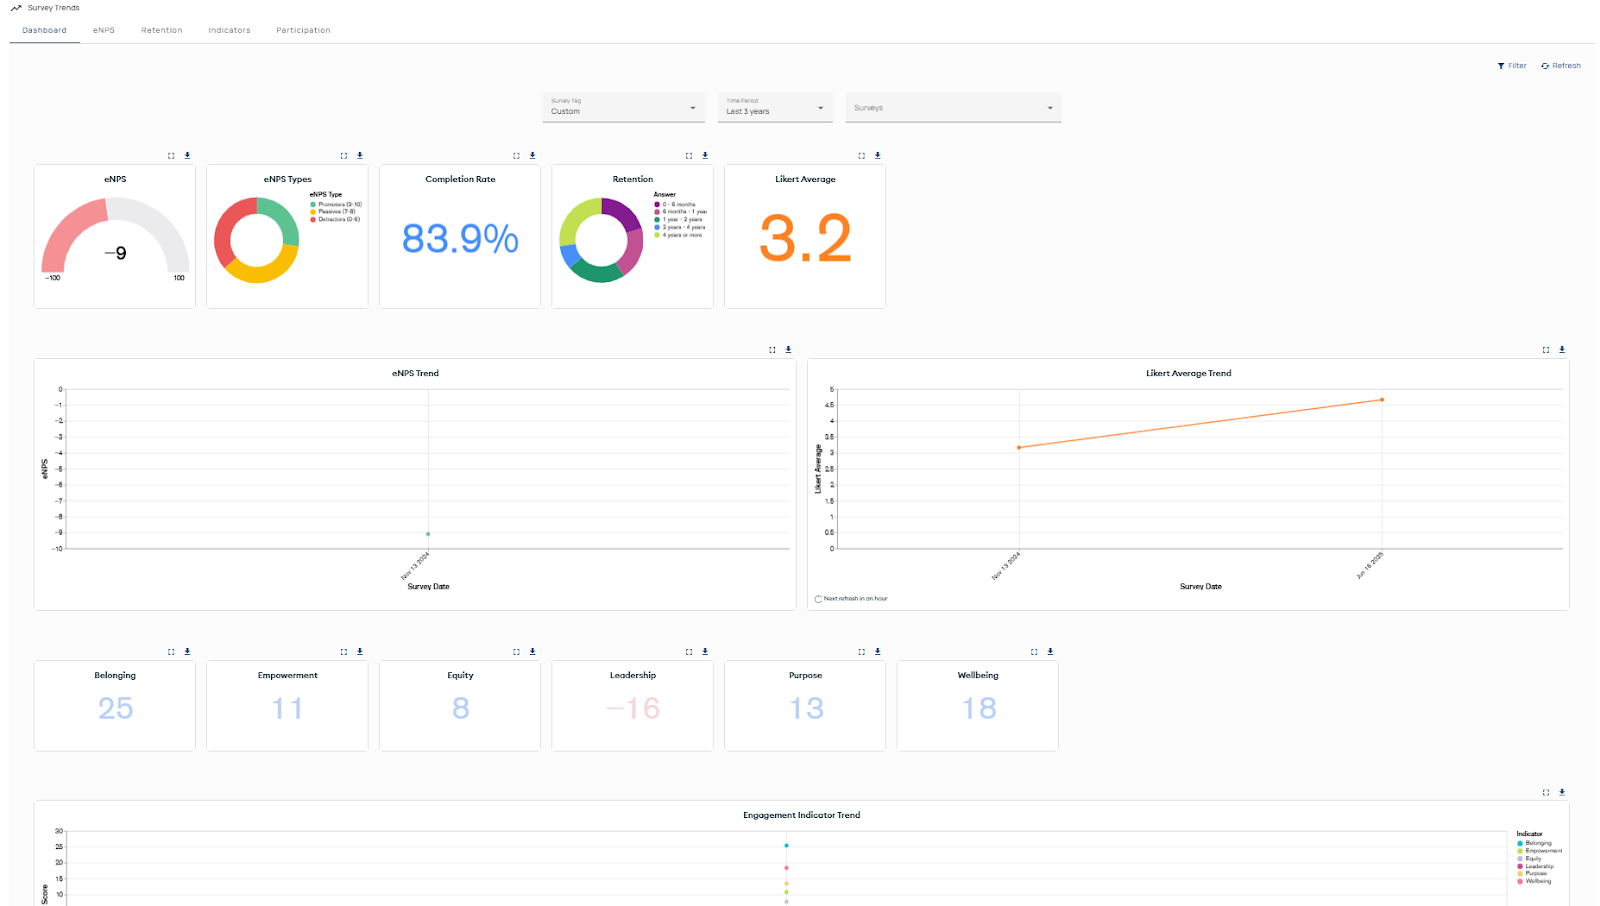
- Dashboard (Landing Page):
- eNPS average across surveys
- Donut chart for Promoters, Detractors, Passives
- Completion rate percentage
- Retention responses
- Likert average
- Line charts for eNPS and Likert trends
- Culture Indicator averages and their trend graphs
- eNPS:
- Shows averages and trends over time.
- Can group by various dimensions.
- Example: Comparing eNPS trends for Canada, India, and the US.
- Retention:
- Displays retention averages, donut, and bar charts.
- Groupable by country, department, or other demographic dimensions.
- Note: For anonymous surveys, results only display if there are six participants or more per group.
- Indicators:
- Aggregates Belonging, Empowerment, Equity, Leadership, Purpose, and Wellbeing.
- Provides both averages and indicator trend lines.
- Allows grouping by a single indicator.
- Participation:
- Completion averages and participation trends across surveys.
- Highlights gaps in response rates.
- Example: A survey may appear in the list with 0% completion, showing it was launched but not answered.
Baseline Trends
When you first open the Survey Trends report, it defaults to baseline surveys from the last three years. These serve as the foundation for understanding organizational shifts.
Use Case: A company conducts a baseline engagement survey before launching a new leadership development program. The Baseline Trends report provides the reference scores for Culture Indicators like Leadership and Purpose. Future surveys are compared against this baseline to measure whether the program improves employee perceptions over time.
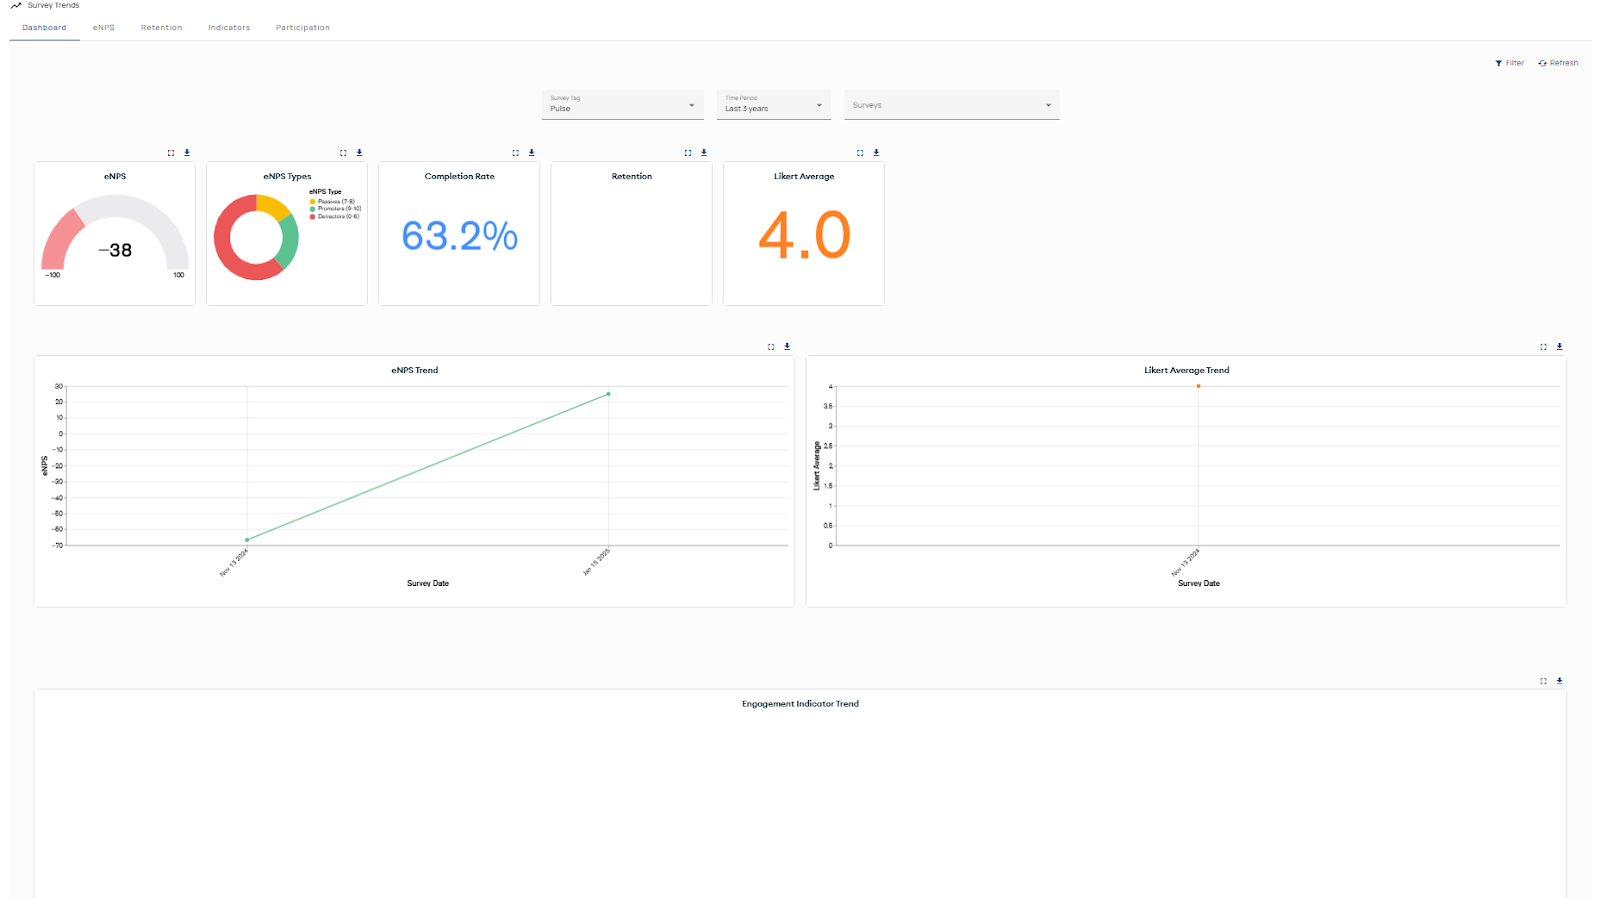
Pulse Trends
The Pulse Trends report tracks short, frequent surveys designed to capture quick shifts in employee sentiment. It follows the same structure as the engagement reports but only includes surveys tagged as Pulse, allowing organizations to monitor rapid changes and trends over time.
Use Case: A company rolls out a new hybrid work policy and wants to measure employee reactions within the first few month. Instead of waiting for the annual engagement survey, HR deploys a short Pulse survey every two weeks. The Pulse Trends report highlights immediate shifts in sentiment, helping leaders adjust communication and support quickly.
Custom Trends
The Custom Trends report displays results from surveys that have been tagged with organization-defined categories. It follows the same structure as engagement dashboards but is tailored to reflect the custom tags each organization applies, making it possible to track themes or initiatives unique to your workplace.
Use Case: A company launches a Diversity and Inclusion initiative and creates a custom survey tag “D&I.” All related surveys are grouped into the Custom Trends report. Leaders can track feedback tied specifically to D&I programs, monitor progress over time, and report on outcomes separately from broader engagement metrics.
New Hire Trends
The New Hire Report track how employees experience their first months in the organization. They follow the same structure as engagement trend reports but focus specifically on surveys tagged as New Hire.
Use Case
New Hire trends let HR and managers spot onboarding pain points early. For example, comparing Engineering vs. Sales may reveal whether certain functions struggle with role integration or leadership alignment.